


Tactic Graph Detector
A type of security detector that groups similar metadata together to ease threat investigation process for analysts.

Project background
🚀 Project Type: B2B enterprise SaaS analytic tool
🎯 Key Outcome: Release MVP of a new detector type with design validation.
🧠 Role: Led end-to-end design, collaborated with PM & eng and UX Research.
📊 Impact: Prioritized features based on user pain points and resource availability.
——
What is Tactic Graph?
It is a security detector that surfaces group pattern UIs on an alert page per its tactics and criteria. Its purpose is to make it easier for security analysts to detect and investigate a threat.
Why was this being asked?
The product team wants to increase product value in the market. When Tageis have more detector types, it eases customers’ investigation experience by reducing its overall investigation time. This helps to compete with competitors in the market as well.
What are some user’s pain points?
Most users take a whole day investigating alerts. Their job is to review hundreds of alerts a day, to find potential threats for their clients. To do so, one needs to inspect events in an alert, to find its pattern or similarities define if an alert is valid or not, and report it. With the help of Tactic Graph, hopefully we can show patterns of grouped events to ease investigation time.
Problem Statement
How might we reduce users’ investigation time by showing them patterns of grouped activities in one glance?
Target User
Security Analysts
Project Stakeholders
Product Managers
Front-end Engineers
Backend Engineers
UX Researchers
Project Timeline
3-6 months
My Role
Lead product designer
Strategy to key challenges
Key challenges
Short release timeline: 3 months
Stakeholders not acting in their role
Ambiguous product requirements and direction
What was my strategy?
To overcome 3 months of MVP release timeline, plus a great deal of ambiguity, I created buy-in by educating and inspiring my product manager to the importance of his role. With his recruitment, I then hosted a design sprint.
The drive behind design sprint
When the project was first handed to me, the only ask was “Make this better”. There was a lack of project requirements, nor a clear understanding of what Tactic Graph does and can do. I struggled to find direction to its product vision and requirements. The ask was to have the design ready 3 months before the development timeline. After not having a unified direction from stakeholders, I decided to facilitate a design sprint/workshop, to find my answers.
Day 1. Discovery and Understanding
I prepared a design sprint storyboard in Miro, and presented through with my participants. From project introduction, going through what the problems were as of today, and learning what user journeys, and workflows were like. I had recruited 3 volunteered security analysis in the room, helping us learn.
Day 2. Research and Ideation
I lead the group to recapping user pain points from day 1 learning, and transform that into how might we help them? Participants were then individually researching, and coming up with ideas using the crazy 8 exercise.
Day 3. Presenting and Voting
After participants submitted their crazy 8 ideas, I had participants go around and present their ideas, and explain why. At the end of the presentation, I asked the participants to vote for their favourite idea. Together, we summarized the favourites. Product manager then decides what makes it to the final view.
Day 4. Prototype
I took the favourites, and transformed them into an actual UI, for prototyping.
Day 5. Test the prototype
The goal was to get some data on the design, per user feedback and performance. However, I was only able to recruit 3 users. The findings were mixed review in certain areas.
Participants
Lead Developer
UI Developers
Product Manager
UX Researcher
Product Designer
My Role
Facilitator
How tactic graph works:
Through the design sprint, I learned more about the overall structure of it:
Observation: Grouping of alerts/events.
Alert: A composite of events that met the criteria of a potential threat.
Event: Multiple occurrences that happen across time.
Tactic Graph Criterias: Tactics and conditions that were written to scan incoming data.


4. Alert Criteria JSON: revealing these script for users to easily prep for evidence once an alert is found positive.
(Wireframes to right)


Features that were created:
Pinning: allowing users to self-pin items that matter to them
Tactic timeline: high level view of what events had been happening across time
Observation table: detailed view of what events were grouped, or not. Along with what values were shared.
(Wireframes to right)
Testing and Results

Usability Testing Round 1:
This round was conducted to find median results on the focused features resulting from the design sprint.
Results:
😐 Most features were tested positive, except pinning.
‼️ Inaccurate tactic timeline.
Usability Testing Round 2:
This round was conducted to find median results on the tactic timline.
Results:
✅ All features were tested positive
✅ Accurate tactic timeline, positive feedback.
Participants
8 security analysts each round, 16 total
Rounds
2
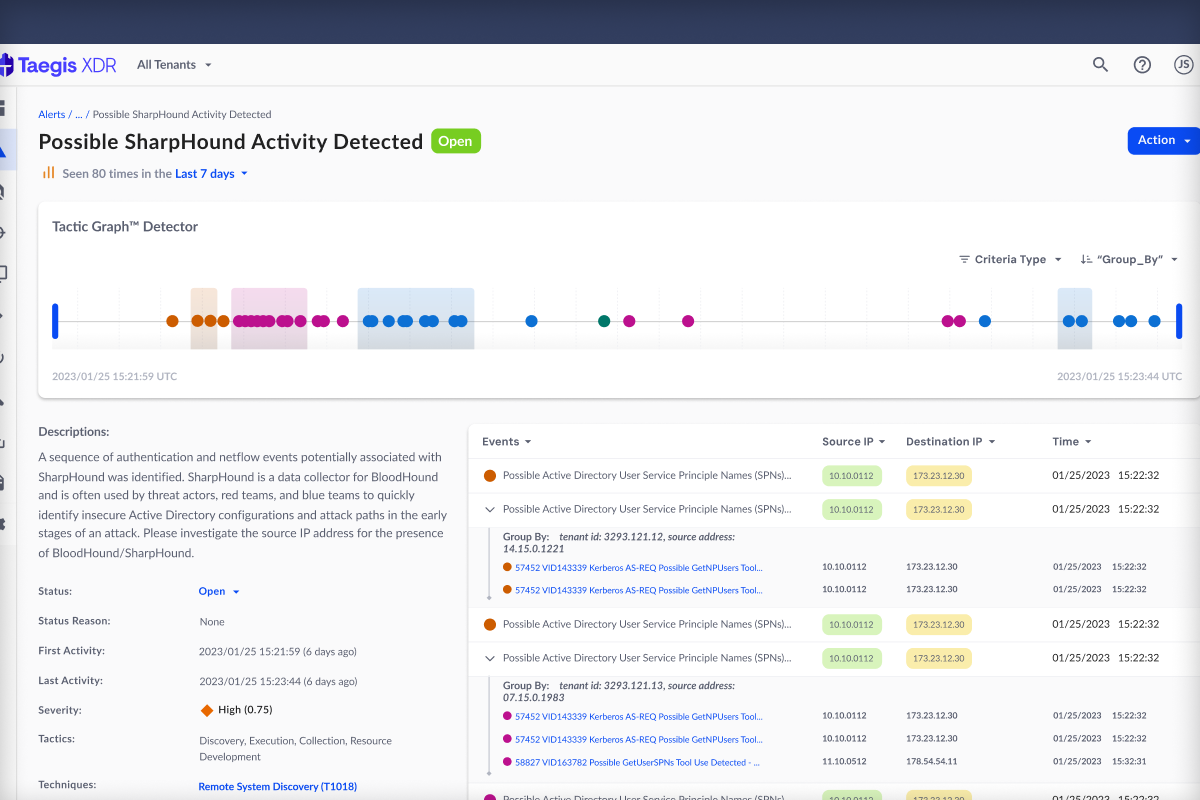
The Final Look for MVP
Click on the expand icon for a prototype experience.